
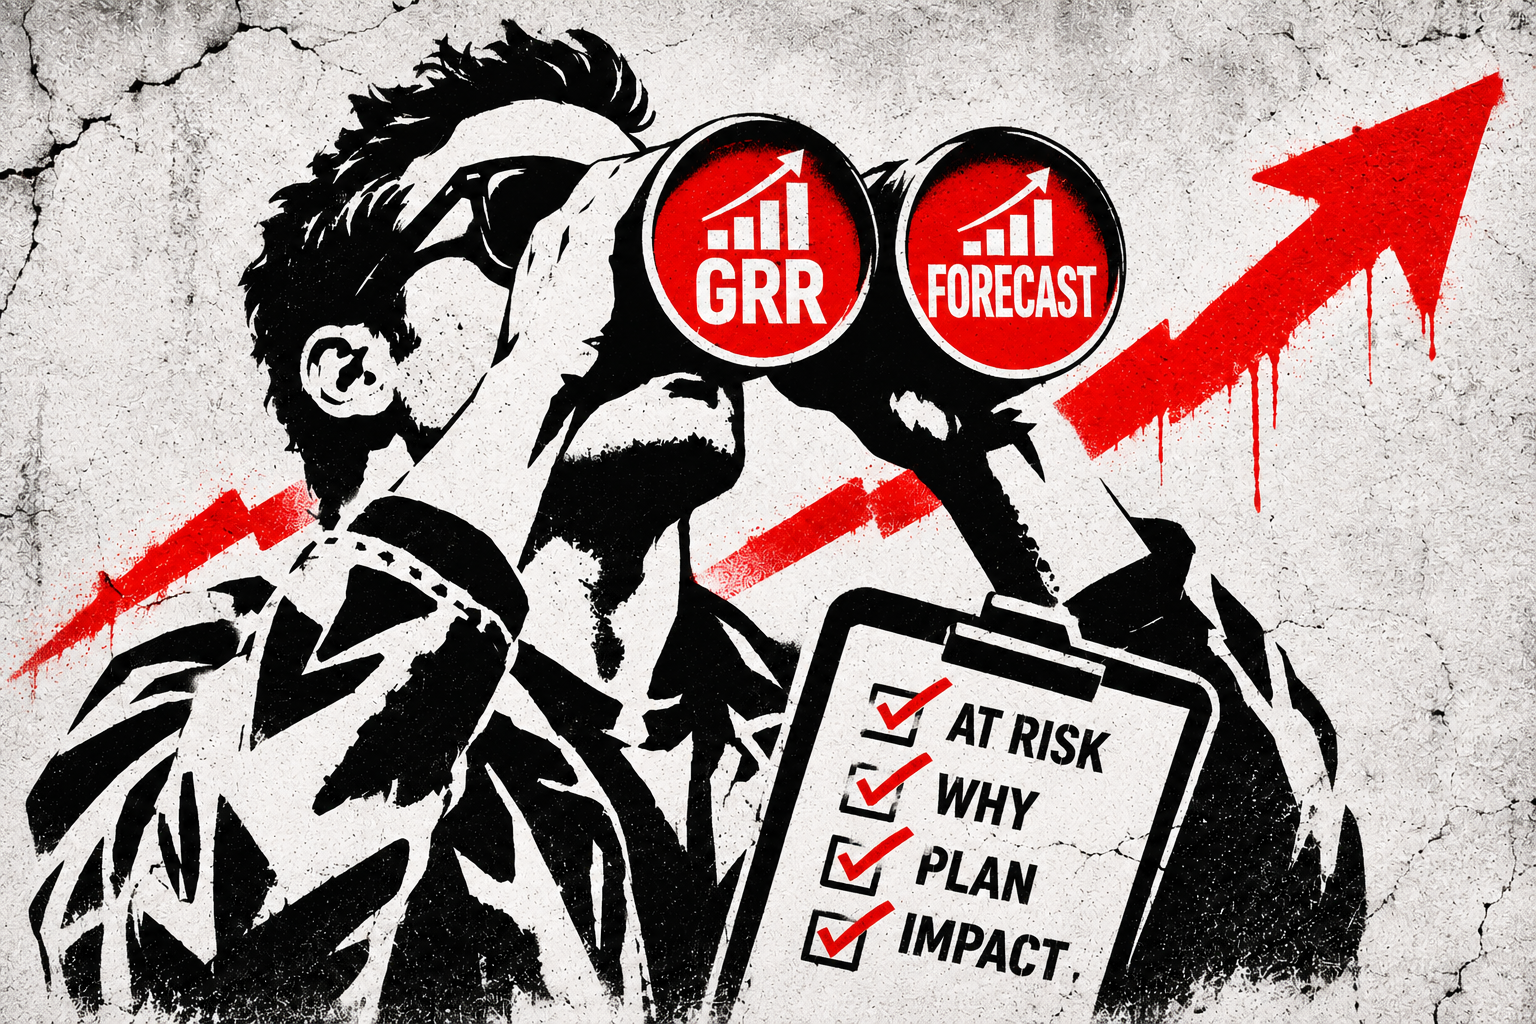
Most retention forecasts are a list of renewal dates. This template treats them like pipeline.
Sales gets a forecast and Customer Success gets a list of renewal dates and some colored boxes.
No CEO, Sales or RevOps leader would accept a sales forecast made up of close dates without clear next steps. They want to know what’s committed, what’s at risk, what moved this week, and what the team is doing about it.
Retention rarely gets the same treatment.
It shows up once a quarter, or the week before a board meeting, as a single percentage. CS owns the number, but few people outside the team understand what’s driving it or what could change it.
Most companies have the data somewhere. Health scores in a CS platform, renewal dates in Salesforce or HubSpot, product usage in a data warehouse, and customer conversations scattered across Slack, email, Gong and E/QBR decks. The definitions don’t always match, and ownership of the inputs can be fuzzy.
Even when CS owns GRR and NRR, the people responsible for those numbers often struggle to explain what sits underneath them without a bunch of queries and last minute conversations.
Who’s the executive sponsor? Is the champion still there? Is the customer actually using the product? Are they realizing the value they expected? What changed since last month?
Too often, everything looks fine until the renewal arrives and the customer sends the dreaded “we’re not going to renew” note. Or worse, they go quiet and the invoice never gets paid.
Ever been surprised by a watermelon account? Green on the dashboard, red underneath.
A renewal date tells you when revenue is exposed. A retention forecast should tell you how much is at risk, why, and what you’re doing about it.
I’ve built this view at every stage, with just about every tool
I’ve worked on this problem at companies ranging from early seed, with six-figure ARR, to businesses well past nine figures.
The goal has been the same: identify customer risk early enough to prioritize resources, intervene before the outcome is decided, and bring the right people or teams across the organization into the conversation.
Here’s a few examples:
| Stage and customer base | What changed | Results |
|---|---|---|
| Early Series B, 200+ enterprise customers | Separated strategic enterprise accounts from the core segment and tailored coverage, renewal motions and expansion plays. | 95% enterprise retention, core-segment churn down 20%, trial opt-outs down 23% |
| Late Series C, 10,000+ customers, roughly 500 enterprise | Built a new health model, rigorous renewal forecast, proactive renewal motions and digital expansion plays during a major company restructuring. | 95% gross retention through the shift, with $1.2M in expansion ARR. |
| Series C, 200+ customers, significant churn challenge | Segmented coverage by complexity and revenue, introduced milestone-based playbooks and moved renewal outreach earlier. | Company-record 10% YoY gain in gross retention, with 90% of trial revenue converted to annual contracts. |
| Series D, usage-based, top 15 strategic enterprise accounts | Connected stakeholder health with value realization, customer workflow milestones and product delivery indicators. | $30M in ACV renewed in less than 12 months and 120% NRR. |
| Late seed, 50+ enterprise and midmarket pilots | Defined success criteria for every pilot, focused on repeatable use cases and introduced onboarding and customer feedback loops. | Trial conversion above 20% and paid conversion up 3X. |
None of these results came from a spreadsheet alone. They came from the decisions, coverage models, playbooks and interventions the underlying visibility helped inform.
The important part wasn’t how sophisticated the forecast looked. It was whether we could see problems forming and do something about them before the situation worsened.
Why I still start with a spreadsheet
Building your own sheet isn’t a requirement. It’s often the fastest path to the truth.
I usually start by getting the forecast into a worksheet before trying to build the perfect dashboard in a CRM, CS platform or BI tool.
At an early-stage startup, that means pulling exports and stitching them together yourself. At a larger company, it often means working through RevOps, CS Ops or the data team to get the fields, definitions and dashboards you need.
Let’s be fair, retention reporting should be a priority, but it often competes with more immediate GTM requests until you’ve built enough evidence to justify the investment.
A spreadsheet gives me room to test assumptions and surface patterns without waiting. Once I’ve found indicators that hold up, I work with the team to bring the logic into the systems we use every day. As the data model improves, we rely less on the sheet and more on the stack.
I still keep the spreadsheet around for scenario planning, validating changes and the occasional exec or board meeting when someone needs a different cut of the numbers.
Remember, company size changes who builds the forecast, not whether you need to understand it.
If you can’t explain how the retention number is built, you can’t defend it.
What a useful retention forecast should tell you

I get asked for examples of how I’ve built retention forecasts, so I recently turned one of my latest working models into a Google Sheets template. There’s a demo with sample data and a blank version with setup instructions and prompts for working with AI tools.
It’s built around the questions I’d expect from a CEO, CRO, CFO, RevOps leader, or the board.
Here’s how it works:
1. Forecasts by contract line, but reads by customer
An enterprise customer might have three products, 3 contracts and 3 renewal dates. Those are separate revenue exposures, but they’re still one customer relationship.
The model tracks the individual contract lines while rolling the relationship and adoption picture up to the account. That makes it possible to understand both the specific product at risk and the broader customer relationship.
2. Turns health signals into revenue exposure
Green, yellow and red health scores are useful starting points, but they’re not a financial forecast.
The model assigns configurable churn probabilities based on health, then adjusts for signals such as a champion leaving, declining usage, missing executive sponsorship, or an extended gap since the last stakeholder conversation.
The model also supports CSM overrides and expected contraction. Just because AI is doing the heavy lifting doesn’t mean your CSMs shouldn’t challenge the output. They may know something about a customer relationship or a recent conversation that the model hasn’t captured. That context should inform the forecast, not get lost in it.
The output is expected lost ARR by quarter and segment, with best-case, base-case and worst-case scenarios.
The starting probabilities are assumptions, not predictions to blindly trust. You should calibrate them against your own renewal history and track how accurately they forecast actual outcomes. This step is crucial!
3. Separates relationships from adoption
One of my favorite views plots customer engagement against adoption and value.

Each quadrant deserves a different response.
A secure account is an opportunity to reinforce value and explore growth. An adoption gap needs enablement and a clearer path to the customer’s desired outcomes. Hidden risk calls for relationship development and executive engagement. Likely churn needs a coordinated recovery plan.
That hidden risk quadrant is especially interesting. A customer may be logging in, consuming the product and looking healthy in every usage dashboard. Their champion left, nobody has spoken to an executive in months, and the buying committee has changed.
Usage alone won’t provide the full story.
4. Measures value, not just activity
Product activity doesn’t always mean the customer is realizing the outcome they bought your product to achieve.
The template adds a Customer Value Score, based on product milestones or stakeholder-validated ROI, alongside usage signals on the adoption axis. It also incorporates Customer Effort Score (CES) as a relationship warning signal and churn probability modifier.
These measures aren’t interchangeable. Utilization tells you how much the product is used. Value realization tells you whether it delivers the intended outcome. Customer effort tells you how hard the customer has to work to get there.
I want to see all three, well before the renewal date.
5. Shows how the quarter is actually closing
Sales teams don’t wait until quarter-end to find out whether the pipeline converted. Retention shouldn’t either.
The dashboard separates retained, lost and still open ARR and tracks how the quarter is closing week by week against the same quarter in prior years. If the business is behind its historical renewal pace in week five, that’s worth understanding before week 13.
You can also see which future quarters carry the most exposed ARR, what portion hasn’t entered a renewal motion, and how customer risk is changing over time.
6. Keeps the forecast honest
Paid pilots and potential conversions are tracked as separate upside, rather than mixed into the gross retention forecast.
Each risk signal has a defined field, the assumptions can be changed, and monthly snapshots make it possible to look back at what the forecast predicted.
Let me emphasize the quiet part out loud: If the model consistently misses churn, you need to know whether the problem is bad data, poorly calibrated probabilities, missing indicators, or optimistic account-level judgment.
A forecast should get better as the team learns, not just produce a new number every week.
What this looks like in practice

The demo includes fictional customer and revenue data so you can see how the different views work together.
For example, the sample company has $4.4M in ARR up for renewal across its open quarters. The model projects 86.1% GRR against a 90% target, with approximately $618K in expected lost ARR.
More importantly, it identifies $730K of open ARR sitting in a hidden risk customer account.
That account has relatively healthy adoption, but weak stakeholder engagement. Without the relationship view, it’s easy to assume the account is fine. That’s the kind of insight I’d want walking into a weekly leadership meeting.
Don’t just put up a slide showing retention is projected below target. Show which customers account for the exposure, why they’re there, and where executive attention or additional resources could change the outcome.
AI makes building and maintaining this much easier
Historically, keeping a complicated forecast spreadsheet updated was tedious. Changing formulas, mapping exports, validating data and checking whether something broke could take longer than the analysis itself.
That’s finally changing. Whether you’re working with Claude, ChatGPT or another AI tool connected to your business systems, you can now use natural language prompts to help map fields, refresh data, inspect changes and even explain what moved.
The template includes eight prompts covering setup, data loading, forecast analysis, probability calibration, scenario planning and ongoing reviews.
You still need to validate the inputs and review changes. AI doesn’t fix inconsistent ARR definitions, stale CRM records or missing stakeholder information just because you ask it to. However, it makes working with that data much more accessible, particularly when you’re a small CS team without dedicated operations support.
I’ve found that the biggest benefit isn’t just generating a report faster. It’s being able to ask more questions of the business without turning every question into another project!
Download the retention forecast template
I’ve made both versions available to use for free below (with attribution if shared).
View the Demo Retention Forecast
Start here to explore the sample dashboard, forecast, relationship and adoption quadrants, and underlying data.
Get the Blank Retention Forecast Template
Make a copy, then open the Start Here tab. It includes setup instructions, source reports to pull from Salesforce, HubSpot, Gainsight and other Customer Success platforms, a data dictionary, and suggested weekly, monthly and quarterly review cadences.
You can get an initial forecast working with just six fields: Account ID, Account Name, Segment, Contracted ARR, Renewal Date and Health Score. Add relationship, adoption and renewal history data as you go.
The template supports 999 contract lines, 1,999 historical closed renewals and 198 pilots. If you have a larger customer base or more complex requirements, the same approach can be built into your data warehouse, BI platform or a lightweight application backed by a database like Supabase.
I’ll share more about some of the other retention and expansion tools I’ve been building in a future post, including where a purpose built application starts to make more sense than a spreadsheet (which is helpful when you’re building from scratch).
Lite Version: If the full version is more than you need, there’s a Lite copy. It’s built for one product and one renewal per customer, so each customer is a single row. It hides the pilots tab and the optional fields for multiple products and usage-based pricing, and setup takes about 30 minutes. The forecast, quadrants and dashboard work the same way. Start with Lite if you sell one product and want the shortest path to a first forecast. Move to the full version when you add a second product or need to track pilots.
Get the Lite Retention Forecast Template
The point isn’t the spreadsheet
It’s having a common understanding of retention across Customer Success, Sales, Finance, Product and the executive team.
When the team can see which customers are exposed, why they’re exposed and what needs to happen next, retention becomes something you can actively manage throughout the year.
You still won’t predict every churn event. But you should be surprised much less often. When your CEO or CRO asks what’s driving the GRR forecast, you should have a better answer than a renewal calendar and a handful of colored boxes to share!
Have feedback on the model, ideas for improving it or questions about adapting it to your team?
Send me an email or connect via Linkedin.
I’m always open to chatting about how Customer Success and post-sales are changing in an AI-native world.
Leave a Reply