
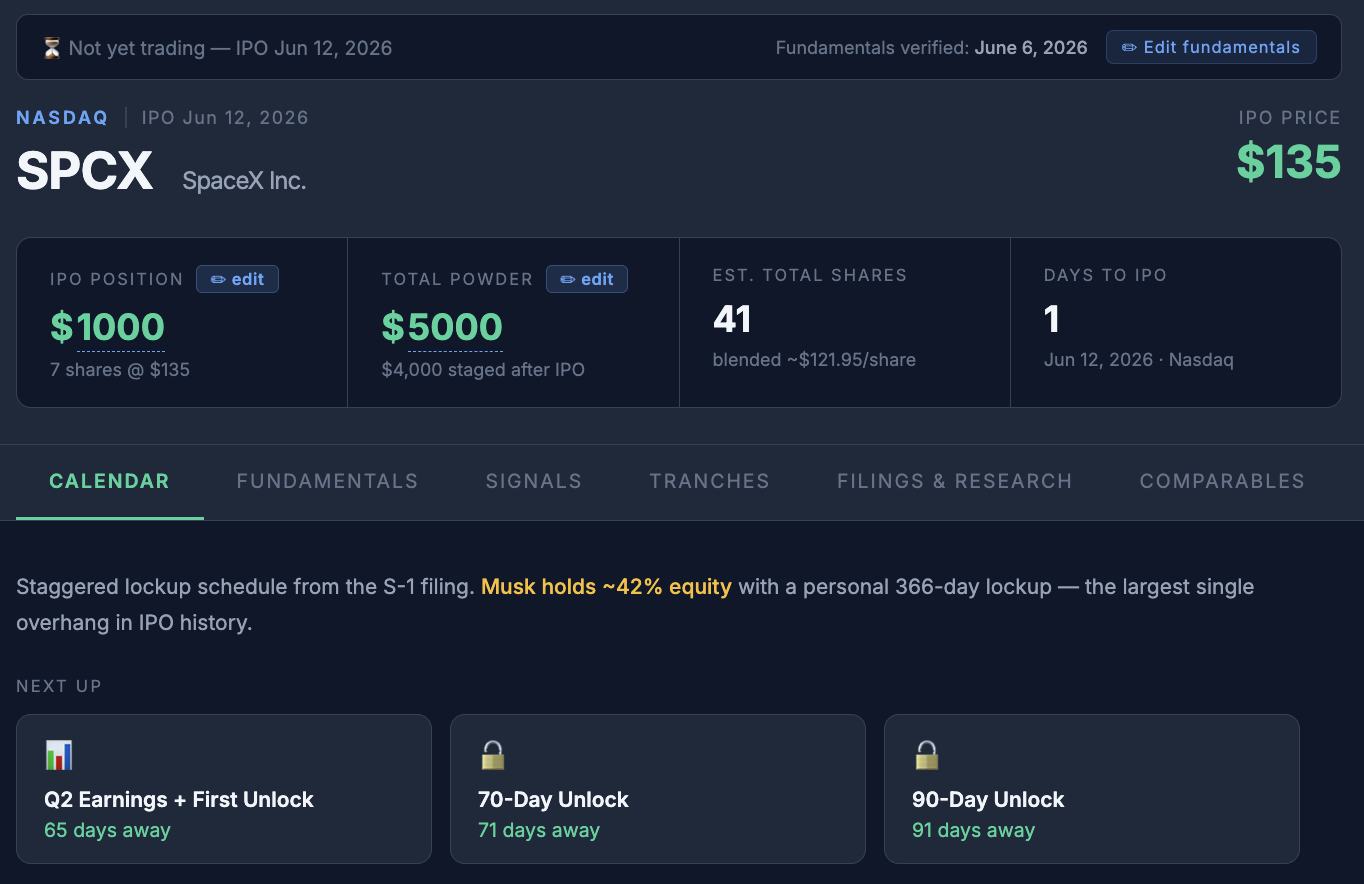
The best way to learn something is to build a thing you’d actually use or find interesting. SPCX priced today and starts trading tomorrow, half my group chats won’t stop talking about it, and the easiest way for me to understand a business is to model it. So while I was digging through the filings this week, I put together a simple tracker.
This is not a buy or don’t buy take. It’s a way to plug in your own assumptions and see where they lead. Use whatever numbers you think are reasonable and come to your own conclusion. The tool links every current filing, flags the signals I think matter most, and runs a base, bull, and ludicrous-case model on the Fundamentals tab. Just enter the allocation size you’re exploring at the top.
Here’s the thinking behind it.
The whole model is one line
Strip away the tabs and the charts and every valuation comes down to this:
Market cap = revenue × multiple
Everything else is just an argument about which revenue and which multiple you believe.
Start with the entry point. At $135 a share, SpaceX is being valued around $1.75 trillion. On $18.7B of 2025 revenue, that’s roughly 94x sales. For context, mature large caps trade in the low single digits to maybe 10x. So you’re not paying for the business as it exists today. You’re paying for what it becomes, and for how long the market keeps handing it a premium multiple.
The point of the three scenarios isn’t to predict the future. It’s to make the assumptions explicit and ask what would have to happen for today’s price to make sense.
The three levers in each case
Every scenario in the tool moves the same three pieces. Here’s where they stand in the filing.
Starlink (Connectivity). The only part of the company making real money right now. It did $11.4B in revenue in 2025 at roughly 63% segment margins, and subscribers went from 4.4M to 8.9M in a single year, hitting 10.3M by the end of March. The catch is ARPU. Average revenue per user dropped from $99 a month in 2023 to $66 by early 2026. So the model is really subscribers times ARPU, and you have to decide whether they keep adding users faster than price falls. Plug in your own curve.
AI (including xAI). $3.2B of revenue in 2025 against a $6.35B operating loss. A cash furnace today, funded almost entirely by Starlink. The bull case assumes this eventually becomes a profitable business rather than a perpetual consumer of Starlink cash flow. The ludicrous case prices in orbital compute and data centers in space, which is a fun idea and a long way from a P&L.
Launch and Starship (Space). About $4B in revenue, with nearly $3B going right back into Starship development. This segment isn’t the headline number, but the cost-per-launch curve is the thing that makes everything above it possible. Cheaper launches are what let you run a satellite broadband business, let alone a data center in orbit.
Each case applies a different growth path and a different exit multiple, then discounts it back. Base stays conservative. Bull assumes Starlink keeps compounding and xAI eventually flips. Ludicrous assumes Starship rewrites the cost of getting to space.
Signals to watch

These are the metrics I’d watch after the open because they’re the ones most likely to change the story:
- ARPU vs subscriber growth. Volume is great until you’re buying it by cutting price. Watch both lines together, not just the subscriber count in the headline.
- AI burn. That $6.35B operating loss is being covered by Starlink cash. Watch whether the gap narrows or Starlink’s cash keeps getting pulled away from everything else.
- Starship cadence and cost. This is the unlock. Launch frequency and cost per ton tell you whether the long-term story has legs.
- Float and index inclusion. A low-float mega-IPO can pull in price-insensitive index buyers fast. This drives short-term price action and tells you almost nothing about the business.
- Governance. Dual-class shares with 10x voting power and a few related-party deals in the filing. Worth knowing who actually controls the company you’d own a tiny piece of.
Short-term risk vs long-term reward
These are two completely different questions, and it’s worth keeping them apart.
Short term is a technical story. Small initial float, massive oversubscription, staggered lockups, and index flows tend to dominate the first stretch of trading. It could pop, it could whip around, and a tall opening premium can fade just as fast. For perspective, many analysts put the fair value at well under half the offer price. None of that mechanics-driven action tells you much about whether this is a good business.
Long term is an options story. Today you’re paying 94x sales for milestones that haven’t been proven yet. If the Starship cost curve holds, Starlink keeps compounding, and the AI bet turns into something real, the upside is massive. ARK has floated $3.1 trillion by 2030. If those milestones slip, you overpaid for a great story. That’s the trade in one sentence: a huge price for a broad range of outcomes.

Run your own numbers
That’s the point of the tool. I’m not going to tell you what to think about the valuation. I’d rather hand you the model, show my assumptions, and let you swap in yours.
Change the inputs. Break the model. See where you land.
Either way, we’re witnessing history 🚀

Leave a Reply